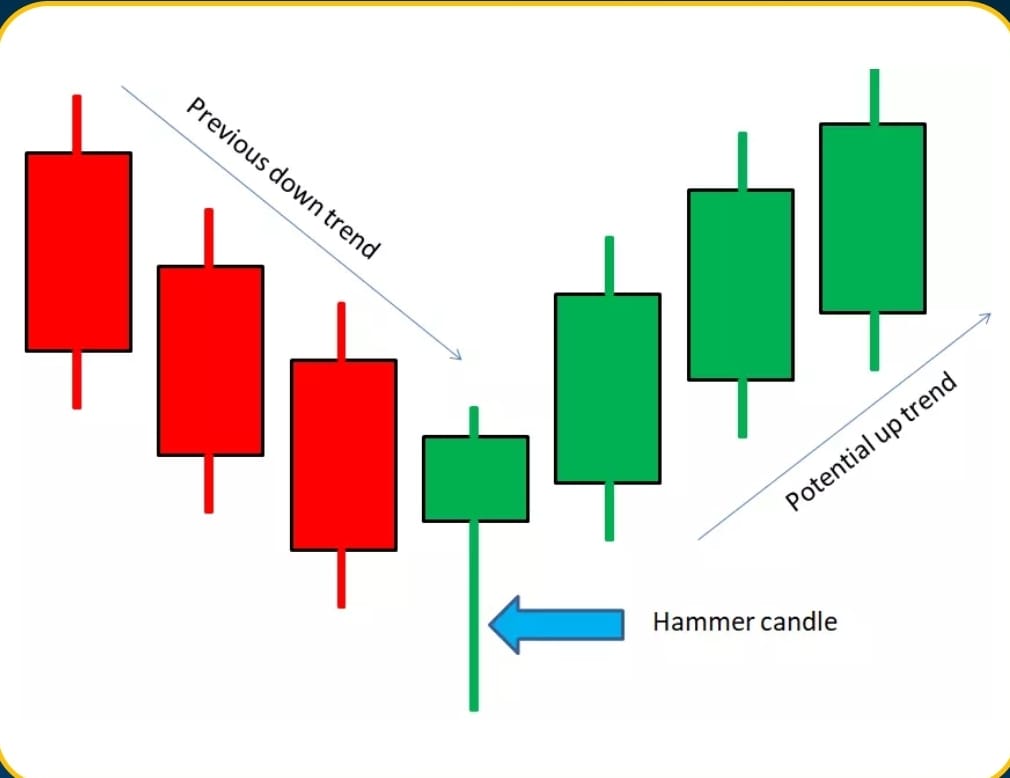
The hammer candlestick pattern is a bullish reversal pattern that forms after a decline in price. It is formed by a single candlestick with a small body and a long lower shadow. The upper shadow is either non-existent or very small in comparison to the lower shadow.
The hammer pattern indicates that selling pressure has been exhausted, and buyers have started to enter the market. It suggests that the bears were in control of the market at the start of the trading session, pushing the price lower. However, the bulls stepped in and were able to push the price back up, forming the long lower shadow.
The hammer pattern is more significant if it appears after a downtrend or a period of selling pressure. If the hammer pattern appears after an uptrend, it may not be as reliable as a reversal signal.
Traders use the hammer pattern as a signal to enter into long positions, anticipating a potential bullish reversal in the market. To confirm the validity of the pattern, traders typically look for additional indicators, such as high trading volume or a bullish confirmation candle in the following session.
It is important to note that the hammer pattern should not be used in isolation, and traders should consider other technical analysis tools and market factors before making any trading decisions based on the hammer pattern.
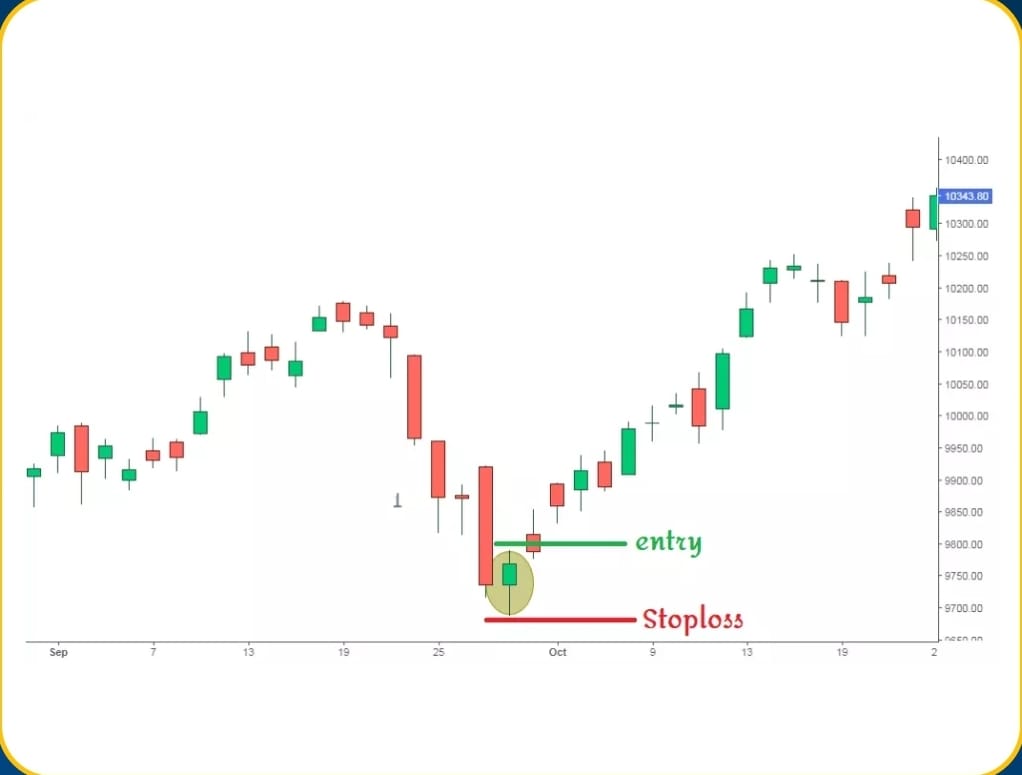
Example
Pattern
Important Point
Here are some important points to keep in mind about the hammer candlestick pattern:
- Hammer pattern is a bullish reversal pattern that forms after a decline in price.
- It is formed by a single candlestick with a small body and a long lower shadow. The upper shadow is either non-existent or very small in comparison to the lower shadow.
- The hammer pattern indicates that selling pressure has been exhausted, and buyers have started to enter the market.
- The hammer pattern is more significant if it appears after a downtrend or a period of selling pressure. If the hammer pattern appears after an uptrend, it may not be as reliable as a reversal signal.
- Traders use the hammer pattern as a signal to enter into long positions, anticipating a potential bullish reversal in the market.
- To confirm the validity of the pattern, traders typically look for additional indicators, such as high trading volume or a bullish confirmation candle in the following session.
- The hammer pattern should not be used in isolation, and traders should consider other technical analysis tools and market factors before making any trading decisions based on the hammer pattern.
- If the price moves higher after the hammer pattern, traders may consider setting stop-loss orders below the low of the hammer candlestick to manage risk in case the pattern fails.